Debugging Tool for XR Platform Engineers

Designing confidence into a debugging workflow — setup dropped from 15+ minutes to under 1 minute for engineers building devices used by millions.

LaunchedDebugging Extension for VS CodeDeveloper Tool~10 weeks (1 week UXR)
28% → 76%
Debugging adoption
88%
Fewer setup errors
~1 min
Setup time (from 15+ min)
76%
Debug Profile usage

Post-launch instrumentation and stakeholder survey (n=14). Adoption reflects teams in phased rollout.

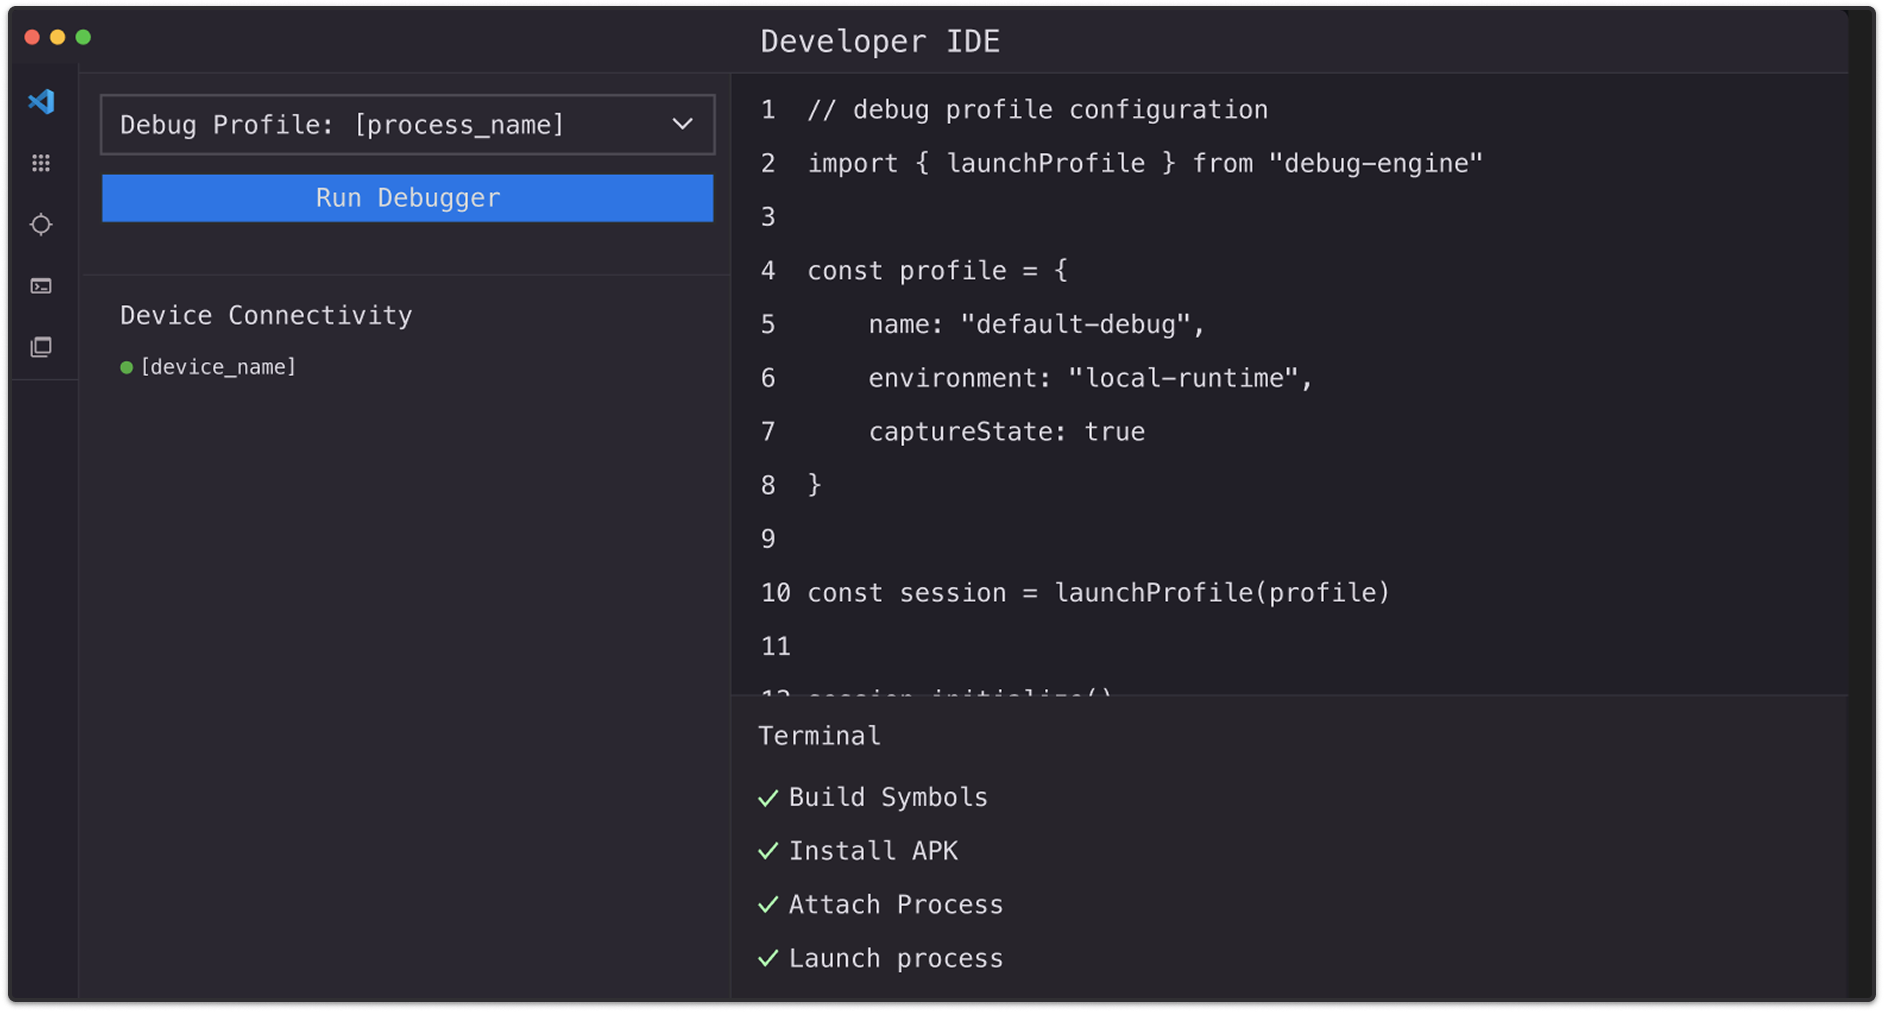
XR Development Extension: a saved debug profile, Run Debugger, and a terminal showing each setup step completed

XR Development Extension is a VS Code extension built specifically for XR hardware development. It centralizes critical workflows like device connectivity, build deployment, and debugging that would otherwise require multiple separate tools.

Strategic TL;DR

The Challenge

Engineers were avoiding the Development Extension for debugging setup (only 28% adoption). Debug sessions required engineers to reconstruct setup configuration every session, manually selecting build targets and debugger settings. The system exposed all configuration options at once regardless of process type, with no guidance through the setup workflow — leaving engineers unsure which configuration path to take or whether debugging was ready.

The Solution

I designed a unified setup assistant inside the Development Extension that guides engineers through debugging configuration before execution begins. The system introduces:

  • Debug Profiles — reusable configurations that eliminate repeated setup
  • Smart Navigator — workflow-aware guidance and autonomy
  • Execution Feedback — clear system signals that show debugging readiness

Instead of manually assembling configuration each session, engineers can launch debugging through a predictable, guided workflow.

Key Impacts

Debugging setup shifted from manual configuration assembly to predictable debugging invocation. Engineers can reuse working configurations, follow a guided setup workflow, and clearly see when the system is ready to debug. This reduced setup friction and increased adoption of the Development Extension for debugging workflows.

://AFTER

Profile → Run → Debug

://BEFORE

Settings → Guess → Debug

My Role & Responsibilities

Core TeamLead Product Designer (me) • 1 Tech Lead • 1 Eng Manager • 3 SWE

What I led
  • End-to-end design of the unified debugging assistant
  • UX research strategy (11 sessions, 3 teams)
  • Two-phase iterative shipping strategy
Cross-Functional Leadership
  • Engineering, product, and infrastructure alignment
  • UX research collaboration and synthesis
  • Stakeholder workshops to resolve priorities
Execution & Delivery
  • VS Code extension constraint management
  • Two-phase iterative shipping (6 months)
  • 28% → 76% adoption growth
  • Instrumentation framework establishment

Context: The Platform and Initial Symptoms

XR Development Extension is a VS Code extension built specifically for XR hardware development. It centralizes critical workflows — device connectivity, build deployment, and debugging — that would otherwise require multiple separate tools.

The platform had strong adoption for connectivity and build workflows, but debugging adoption was surprisingly low — only 28% of engineers were using the extension for debugging, even though the underlying technical capabilities existed.

We needed to understand why.

Debugging Ecosystem

Discovery: Uncovering Why Engineers Avoided Debugging

To understand the 28% adoption problem, I led a research effort across 3 engineering teams over 6 weeks. The goal was to observe real debugging workflows and understand where engineers were getting stuck.

Research Process

11 User Sessions

Shadowing debug workflows

Observed engineers spending 15+ minutes configuring debuggers, then abandoning setup due to errors. Many reverted to CLI tools mid-session.

14 Interviews

Engineers & stakeholders

“I just use CLI because I don't trust the extension” was a repeated theme. Engineers wanted a system they could rely on without fear of mid-debug crashes.

Mapping the Debugging Journey

Friction points:Manual configuration (3+ times per day, every session)Setup failuresMid-flow confusion“Did I even select the right process?”

Primary Targeted Users

APK Developer

Focuses on creating applications for the Android platform.

Focus areas in the extension: building and testing APKs, working with the Android SDK and libraries, app performance, testing, and debugging.

AOSP Developer

Works on developing and modifying the Android operating system itself (Android Open Source Project).

Focus areas in the extension: modifying Android OS source code, building entire system images, and flashing devices.

MR Developer

Develops applications and systems for mixed-reality platforms such as VR and AR devices.

Focus areas in the extension: debugging across the application and OS boundary — runtime attachment, sensor integration, and frame timing.

What Research Revealed

Debugging itself wasn't technically broken — the debugging session setup experience surrounding it was.

Engineers encountered three recurring sources of friction: uncertainty about where debugging should begin, repetitive configuration work, and confusion during setup progression.

These issues created hesitation and pushed engineers to rely on external tools instead of the extension.

Problem Synthesis: Structural Breakdowns in Debug Setup

Through research and workflow mapping, I realized that debugging adoption wasn't blocked by missing capability. It was eroded by structural breakdowns in how debugging setup worked.

These were not isolated UX issues — they were systemic failures in how debugging configuration and readiness were modeled inside the development workflow.

Three breakdowns consistently surfaced.

Starting from Scratch Every Time

Debug sessions were not persistent. Configuration lived in engineers’ memory rather than in the system itself.

Each session required manually re-entering build targets, device selections, and debugger settings — often multiple times per day.

This wasn’t just inefficiency — it introduced entropy into the debugging workflow. Each session began with reconstructing context rather than debugging code.

Configuration Confusion

The interface exposed configuration inputs, but not the workflow logic behind them.

Engineers had to decide which device to connect, which build target to select, and which debugger configuration to use without clear guidance.

This forced engineers to rely on tribal knowledge and trial-and-error. Instead of guiding engineers toward a valid configuration, the system assumed expertise.

Unclear Debug Readiness

Even after configuration was complete, engineers lacked visibility into whether the system was ready to debug.

Build steps, device connectivity, and debugger attachment happened across multiple processes with limited feedback.

When debugging failed, it was often unclear where the failure occurred or what to fix next. Debugging felt like a black box.

Observed behavior during debugging setup

Synthesis:

Together, these breakdowns created an unpredictable setup experience.

Before engineers could debug code, they first had to debug configuration.

Trust eroded before the debugger even attached.

//:AHA MOMENT! Debugging Setup Needed Structure

This realization shifted the direction of the project.

If the real problem was uncertainty during setup, improving debugger capability wouldn't solve it. The experience needed to be redesigned before execution even began.

Engineers didn't need a more powerful debugger — they needed a place where debugging setup had memory, structure, and guidance built in.

The opportunity wasn't adding more debugging power. It was designing a setup orchestration layer that could:

  • Remove workflow uncertainty
  • Persist configuration context
  • Guide engineers through the correct setup process

This reframed debugging from manual configuration assembly into predictable debugging invocation.

Alignment & Ecosystem

Defining What Success Looks Like

Before designing solutions, I worked with engineering, platform, and infrastructure partners to define what better debugging setup should look like — and how we would measure it.

Different stakeholders interacted with debugging workflows in different ways, which meant success needed to balance developer productivity, system reliability, and platform adoption.

Engineering Teams

Developers working on platform features and applications

  • Speed — “I need to debug immediately.”
  • Reliability — “Debugging should work every time.”
  • Clarity — “I shouldn’t need to ask someone how to set this up.”

Platform Team

Maintainers of the Development Extension

  • Adoption — establish the extension as the primary debugging entry point
  • Maintenance — reduce fragmentation across debugging tools
  • Consistency — standardize debugging workflows

Infrastructure Team

System reliability and scale

  • Scalability — support debugging across many engineers
  • Stability — avoid introducing system fragility
  • Automation compatibility — remain compatible with CI/CD workflows

Product & Engineering Leadership

Strategic impact and execution

  • Measurable developer productivity improvements
  • Iterative rollout with minimal workflow disruption

Shared Success Framework

Through alignment sessions and research synthesis, we defined success as balanced developer productivity, reliability, and platform adoption.

Primary Metrics (North Star)

Adoption Rate
Percentage of engineers using the Unified Setup Assistant instead of legacy debugging setup.
Setup Time
Time from “I want to debug” → “debugger attached.”

Secondary Metrics

Setup error rate
Reduction in configuration failures
Debug Profile usage
Saved configurations vs manual setup
Retention
Repeat usage over time

How We Got Aligned

To ensure the redesign addressed real ecosystem needs, I facilitated a structured alignment process across engineering, platform, and infrastructure teams.

  1. Shared Research Readout

    I presented key research insights to all stakeholders in a single session to build a shared understanding of the debugging challenges. Instead of summarizing findings, I showed short interview clips of engineers struggling with debugging setup. Seeing the same moments of friction helped the group align on the core problems: setup repeated every session, configuration confusion, and unclear debugging readiness.

  2. Success Definition Workshop

    I facilitated a two-hour working session where each stakeholder group defined what “better debugging setup” meant from their perspective. Together we mapped areas of alignment and surfaced key tensions, such as:

    • Engineers prioritizing speed of debugging setup
    • Infrastructure teams prioritizing system stability and reliability

    This exercise clarified the tradeoffs the design needed to balance.

  3. Prioritizing Shared Metrics

    We then identified metrics that would signal meaningful improvement across teams. Two priorities emerged as universal indicators of success:

    • Setup time — how quickly engineers could start debugging
    • Setup error rate — how often configuration failed

    Other considerations such as automation compatibility remained important but were treated as design constraints rather than primary success metrics for the initial release.

  4. Shared Success Framework

    Finally, I documented the agreed-upon success framework in a concise alignment document shared across teams. This became the reference point for product decisions, helping resolve tradeoffs and keeping the redesign focused on measurable improvements to the debugging workflow.

Design Strategy

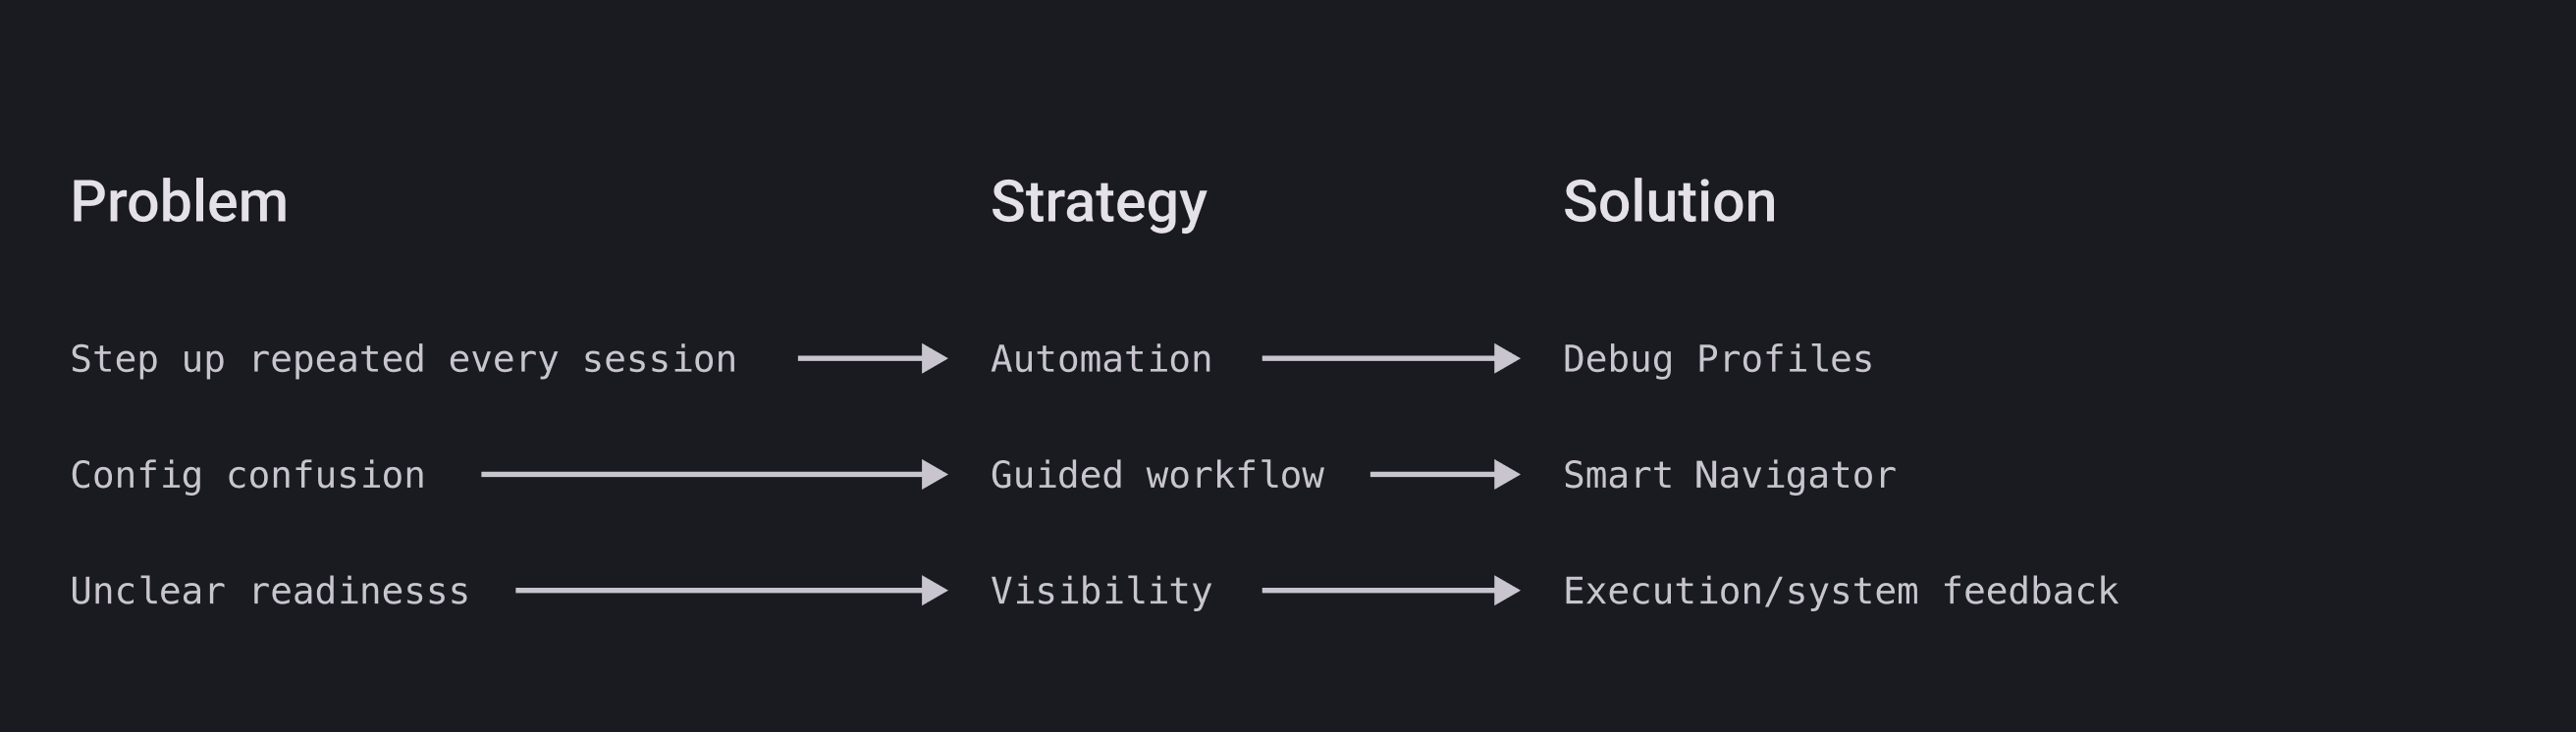
From the research synthesis, I identified that debugging friction came from three structural issues: setup repeated every session, configuration confusion, and limited visibility into debugging readiness.

Rather than adding more controls to the interface, the goal was to restructure the debugging experience around efficiency, guidance, and system transparency.

This led to three core design principles that guided the solution.

Automation & Efficiency

Reduce repetitive setup work by shifting configuration effort from every debugging session → reusable setup once.

Engineers should be able to configure debugging once and launch it instantly.

Enabled by

  • Debug Profiles
  • One-click debug launch

Guided Decision-Making

Replace configuration guesswork with structured workflows that guide engineers to the correct debugging setup.

Instead of exposing every option at once, the interface surfaces the next relevant action based on context.

Enabled by

  • Workflow Navigator / AI bug assistant
  • Context-aware configuration flows

Visibility & Trust

Make debugging workflows predictable and understandable by exposing key system states and progress signals.

Engineers should clearly know what the system is doing and when debugging is ready.

Enabled by

  • Structured debugging steps
  • Clear execution feedback
Problem → Strategy → Solution: setup repeated every session → automation → Debug Profiles; config confusion → guided workflow → Smart Navigator; unclear readiness → visibility → execution / system feedback

Strategic boundaries

To keep the experience focused, we deliberately avoided expanding scope:

  • Building a new debugger from scratch
  • Adding more configuration complexity
  • Creating another entry point that fragments the workflow

Solution Deep Dive

Fragmented setup with no clear workflow

Before →

Guided setup with reusable configurations and visible progress

After

See it in action

The flow below simulates how Debug Profiles, Smart Navigator, and Execution Feedback work together. Select a developer profile and walk through the setup.

Developer IDE

Developer IDE

apk-debug1 min ago
</> Android XR
Quest 3
aosp-debug2 hrs ago
</> Android HMD
HMD Target
⚠ Device offline
mr-debug3 hrs ago
</> Quest 3 Pro
No device specified
✗ No device
apk-test1 day ago
</> Android XR
Quest 3
⚠ Device offline
aosp-debug1 day ago
</> Android HMD
HMD Target
mr-debug4 days ago
</> Quest 3 Pro
Quest 3 Pro
⚠ Device offline
build-flash7 days ago
</> Build Flashing
Quest 3
aosp-debug7 days ago
</> Android HMD
HMD Target
mr-debug7 days ago
</> Quest 3 Pro
Quest 3 Pro
⎇ mainAndroid XR DebuggerUTF-8Kotlin

Debug Profiles: Eliminating Setup Reconstruction

Automation & Efficiency

One of the core problems uncovered in research was that debugging setup was stateless. Engineers repeatedly rebuilt the same configuration across sessions.

To address this, I designed Debug Profiles — a way to persist and reuse validated debugging configurations. Engineers configure their debugging environment once, save it, and reliably relaunch it later without re-entering setup details. This shifts debugging from manual reconstruction to repeatable invocation.

Reusable Configuration

Previously used configurations are surfaced for quick reuse, eliminating repeated setup.

Instant Profile Switching

Engineers can launch or switch debugging configurations instantly without leaving the workflow.

Key Design Decisions

Centralized Access
All saved profiles live in a single surface, making it easy to return to previously working setups across sessions.
One-Click Launch
Saved configurations load instantly without manual re-entry, removing setup work engineers were repeating multiple times per day.
Usage-Aware Starting Points
The system surfaces recent and related debugging configurations as starting points, so engineers customize an existing setup rather than start from scratch.

Outcome

Debug Profile usage reached 76%. Engineers now start from saved, known-good configurations instead of rebuilding from memory — the 3×-per-day reconstruction overhead was removed at the model level, not through UI shortcuts.

Smart Navigator: Guided Setup Workflow

Guided Decision-Making

Research also revealed that engineers often didn't know what to do next during debugging setup. Configuration options were scattered, and incorrect inputs often surfaced only after execution failed.

To address this, I designed a workflow-aware setup experience that adapts to what engineers are debugging. Instead of exposing every configuration option at once, the interface adjusts based on context — showing only relevant inputs, validating configuration progressively, and surfacing clear next steps.

Context Aware Setup Guidance

The system surfaces the next required setup action based on the selected debugging configuration.

Key Design Decisions

Progressive Disclosure
Only relevant options appear based on previous selections, reducing cognitive load and preventing invalid configurations.
Context-Aware Recommendations
The system suggests common setup paths based on the current configuration, helping engineers move forward with confidence.
Inline Explanations
Contextual guidance explains why certain inputs are required, reducing guesswork during setup.

Outcome

The guided workflow transformed debugging setup from an overwhelming configuration form into a clear, structured process. Engineers no longer needed to infer workflow logic — the system made the path forward explicit.

Execution Feedback: Visible Execution State

Visibility & Trust

Even after configuration is complete, engineers often face uncertainty during debugging execution. Logs, build steps, and system feedback are typically scattered across tools, making it difficult to understand what the system is doing or whether debugging is progressing correctly.

To address this, I designed clear execution feedback directly within the debugging workflow, allowing engineers to understand system state without leaving the environment. Instead of relying on external logs or terminal output, the interface surfaces key signals in place.

Real Time Setup Progress

Setup steps run automatically with clear progress indicators, showing when debugging is ready.

Key Design Decisions

Structured Execution States
Debug sessions expose clear stages such as Initializing, Building, Running, and Connected, allowing engineers to quickly understand progress.
Inline System Feedback
Relevant logs and system messages appear within the workflow instead of requiring engineers to search across multiple tools.
Failure Localization
If debugging fails, the interface highlights the step where the failure occurred and suggests possible causes.

Outcome

By surfacing system feedback directly within the debugging workflow, engineers gain confidence that the system is behaving as expected. Debugging no longer feels like a black box — the system clearly communicates what is happening and what to do next.

Designing Within Platform & Design System Constraints

The project introduced significant changes to both the layout and interaction model of the debugging setup experience. However, many of the proposed UI components did not yet exist in the shared design system used by the Development Extension.

In addition, several of these components would need to be reusable across the broader editor ecosystem, which required collaboration with the editor platform team.

This created a delivery constraint: engineering needed a lower-effort path to begin implementation, while the long-term design direction required new components to be developed and standardized.

Phased Implementation Strategy

To balance design ambition with implementation feasibility, we structured the rollout in two phases.

Phase 1

MVP Launch

Focus on high-impact, low-risk improvements that could be implemented using existing design system components.

//:Key improvements included:

  • Surfacing critical debugging actions more clearly
  • Persisting configuration state through Debug Profiles
  • Introducing early workflow guidance without requiring new UI primitives

→ This allowed engineering teams to begin shipping improvements quickly while validating the new debugging workflow.

Phase 2

Iterative Enhancement

A full visual and interaction overhaul was planned once the required design system components became available.

//:This phase enables:

  • Expanded capabilities in Smart Navigator
  • Improved workflow visualization
  • Deeper integration with the shared editor design system

→ The complete experience is planned for full rollout later in the year.

The shift

From manual configuration → predictable, guided setup

Reusable configurations, guided workflows, and clear system feedback reduced errors and startup time.

Setup repeated every session

Debug Profiles

76%

Usage

Reusable configurations replaced manual setup

Configuration confusion

Smart Navigator

88%

Error reduction

Guided workflows eliminated incorrect configurations

Unclear readiness

Execution Feedback

~1 min

Setup time

Clear system state enabled a faster debugging start

28% → 76%

Overall debugging adoption. The lagging indicator — profile usage and error reduction explain why it moved. When setup stopped failing silently, the CLI hedge stopped being necessary.

Validated via post-launch instrumentation and stakeholder survey (n=14). Adoption figures represent teams in phased rollout.

Reflection & Next Steps

This project reframed debugging from a configuration task into a workflow design problem.

By introducing reusable configurations, guided setup, and visible system state, debugging shifted from a fragmented process into a predictable and reliable experience.

What I learned

Beyond the solution itself, this project reshaped how I think about designing for complex workflows:

Saving state is more powerful than adding features
Persisting configuration removed more friction than expanding functionality.
One clear workflow beats many options
Guided setup replaced guesswork with a predictable path forward.
Design for flexibility early
Accounting for evolving workflows upfront enabled the system to scale without redesign.
Confidence drives adoption
The tools already worked — engineers needed a setup experience they could trust.

Future Opportunities

With strong adoption in initial teams, the next step is evolving this into a more unified system:

  • Expand across additional workflows and teams
    Validate new use cases and extend adoption beyond initial environments.
  • Establish as the default debugging workflow
    Position the setup assistant as the primary entry point and gradually retire legacy paths.
Melis Lawlor → Senior Product Designer based in San Francisco, CA

About

Melis Lawlor

Product Designer based in San Francisco, CA

I'm Melis, a product designer focused on tools that help engineers do complex work with more clarity and less friction.

At Google, I worked across developer tools, from debugging and release workflows to dashboards that help teams investigate issues and make launch decisions. Chrome Platform Status was one project within that broader work.

At Meta Reality Labs, I design AI-native tools that support engineers across coding, debugging, automation, and delivering reliable code updates. The work moves quickly, so I partner closely with engineers to clarify emerging needs, prototype possible directions, and make design decisions while the product is taking shape. As the sole designer in my organization, I've helped make discovery and design review part of that process.

Before product design, I studied Architecture. It shaped how I think about systems: how people move through them, where they lose context, and what helps them take the next step. I bring that same attention to technical workflows, starting with what engineers actually do rather than what a tool assumes they do.

I use AI to explore ideas and build interactive prototypes, moving between Figma and code to test how an experience works. I'm most interested in the point where complex systems become useful: when an engineer can understand the state of their work, trust the next action, and keep moving.

Selected 0→1 AI Systems (NDA)